
Dessert nutrition varies dramatically across categories—a single slice of cheesecake delivers 400+ calories with 32g sugar, while a serving of dark chocolate provides antioxidants alongside its 170 calories. Sweet nutrition profiles reveal that ice cream nutrition ranges from 130 calories (light varieties) to 350+ calories (premium brands) per half-cup, while candy nutrition spans from 60-calorie fun-size bars to 300-calorie full-size options. After analyzing over 4,500 food samples throughout my career in federal nutrition research, desserts represent the most calorie-dense food category with the widest variation between products, making informed selection essential for those incorporating treats into balanced dietary patterns.
Table of Contents
Understanding Dessert Nutrition: The Science Behind Sweet Indulgence
The dessert category encompasses an extraordinary diversity of sweet preparations—from frozen treats and baked goods to confections and chocolate—each concentrating calories through characteristic combinations of sugar, fat, and refined flour. When examining dessert nutrition facts from a biochemical perspective, we observe that these foods deliver sensory pleasure through ingredients that trigger reward pathways while providing minimal essential nutrition.
From my years conducting food composition analysis at research facilities, I’ve documented how ice cream nutrition, cake nutrition, and candy nutrition differ based on ingredient quality, portion size, and manufacturing processes. Understanding dessert composition helps consumers make informed choices when incorporating treats into dietary patterns—neither demonizing desserts nor consuming them without awareness.
The Caloric Density Challenge
Desserts achieve remarkable caloric density through ingredient concentration. While vegetables provide 15-50 calories per cup, desserts commonly deliver 200-500 calories in equivalent volumes. This density results from:
Sugar concentration: Refined sugars provide 4 calories per gram with no fiber, protein, or micronutrients to slow consumption or signal satiety. A typical slice of cake contains 30-50g sugar—equivalent to 7-12 teaspoons.
Fat content: Butter, cream, oils, and chocolate contribute 9 calories per gram—more than double the caloric density of protein or carbohydrates. Premium ice cream derives 50-60% of calories from fat.
Refined flour: Stripped of fiber and nutrients, white flour provides primarily starch that converts rapidly to glucose without promoting fullness.
Minimal water content: Unlike fruits or vegetables, most desserts contain little water, eliminating the volume that creates physical satiety at lower calorie counts.
For those pursuing nutrition classes or nutrition science certification credentials, understanding dessert caloric density helps communicate why portion control matters more for treats than for whole foods.
Sugar Types and Metabolism
Desserts employ various sweeteners with different metabolic effects:
Sucrose (table sugar): 50% glucose, 50% fructose; the standard against which other sweeteners compare.
High fructose corn syrup: Similar composition to sucrose (typically 55% fructose); metabolically comparable despite marketing claims otherwise.
Honey and maple syrup: Natural sweeteners with marginally more micronutrients but equivalent caloric and glycemic impact.
Sugar alcohols (sorbitol, erythritol): Reduced-calorie sweeteners (0-3 calories per gram) that may cause digestive discomfort in sensitive individuals.
Artificial sweeteners: Zero-calorie options enabling sweet taste without caloric contribution; ongoing research examines metabolic effects beyond calories.
The nutrition care process in clinical settings addresses dessert consumption strategically—understanding that complete restriction often backfires while unrestricted consumption undermines health goals.
Nutrient Density Perspective
Most desserts provide what nutritionists term “empty calories”—energy without proportional micronutrients. However, some desserts offer modest nutritional contributions:
Dark chocolate: Flavanols, magnesium, iron, and antioxidants alongside calories
Nut-based desserts: Protein, healthy fats, and minerals from nuts nutrition content
Fruit-based desserts: Some vitamins and fiber retained from fruit components
Dairy desserts: Calcium, protein, and B vitamins from milk/cream base
Understanding this spectrum helps navigate dessert choices—when indulging, options with genuine nutritional contribution provide more than pure sugar-and-fat combinations.
Ice Cream Nutrition: America’s Favorite Frozen Dessert

Ice cream nutrition demonstrates the dessert category’s wide variation—from 130-calorie light versions to 350+ calorie premium products per half-cup serving. This section provides comprehensive analysis of ice cream categories and alternatives.
Regular Ice Cream
Standard vanilla ice cream per half-cup (66g) serving:
Table 1: Regular Vanilla Ice Cream Nutritional Profile
| Nutrient | Amount | % Daily Value |
|---|---|---|
| Calories | 137 | 7% |
| Protein | 2.3g | 5% |
| Carbohydrates | 16g | 6% |
| Sugar | 14g | — |
| Total Fat | 7.3g | 9% |
| Saturated Fat | 4.5g | 23% |
| Cholesterol | 29mg | 10% |
| Calcium | 84mg | 6% |
| Sodium | 53mg | 2% |
Regular ice cream provides modest protein and calcium from its dairy base while delivering substantial saturated fat and sugar. The actual serving size—half cup—often surprises consumers accustomed to larger bowls.
Premium Ice Cream
Premium and super-premium ice cream per half-cup serving:
Table 2: Premium Ice Cream Nutritional Profile
| Nutrient | Amount | % Daily Value |
|---|---|---|
| Calories | 250-350 | 13-18% |
| Protein | 4-5g | 8-10% |
| Carbohydrates | 20-28g | 7-10% |
| Sugar | 18-24g | — |
| Total Fat | 16-24g | 20-31% |
| Saturated Fat | 10-15g | 50-75% |
Premium ice cream’s denser texture results from higher fat content and less air incorporation—the same volume contains substantially more calories than regular varieties. A single half-cup serving may provide 50-75% of daily saturated fat limits.
Light and Reduced-Fat Options
Table 3: Ice Cream Varieties Comparison (per half-cup)
| Type | Calories | Fat | Sugar | Protein | Trade-offs |
|---|---|---|---|---|---|
| Regular | 137 | 7.3g | 14g | 2.3g | Standard profile |
| Premium | 250-350 | 16-24g | 20-24g | 4-5g | Dense, rich |
| Light | 100-130 | 3-5g | 12-16g | 3g | Often more sugar |
| No Sugar Added | 90-120 | 5-8g | 4-6g | 3g | Sugar alcohols |
| Non-Dairy | 150-250 | 8-16g | 12-22g | 1-2g | Coconut/oat base |
Light ice cream reduces calories primarily through lower fat content, though some brands compensate with increased sugar. “No sugar added” varieties use sugar alcohols that may cause digestive discomfort. Non-dairy options vary widely—some match or exceed regular ice cream calories despite dairy-free positioning.
Frozen Treats Comparison
Drumstick nutrition and similar novelty items require examination:
Table 4: Frozen Novelty Treats Comparison
| Treat | Calories | Fat | Sugar | Serving |
|---|---|---|---|---|
| Drumstick (classic) | 290 | 15g | 22g | 1 cone |
| Ice Cream Sandwich | 160 | 6g | 15g | 1 sandwich |
| Fudge Bar | 90 | 2g | 14g | 1 bar |
| Fruit Bar | 70 | 0g | 14g | 1 bar |
| Ice Cream Bar (coated) | 250-330 | 17-22g | 20-26g | 1 bar |
Chocolate-coated bars and cone products add substantial calories beyond ice cream alone. Fruit bars provide lower-calorie options, though sugar content remains significant.
Cake and Baked Dessert Nutrition: From Simple to Elaborate

Cake nutrition varies enormously based on type, frosting, and portion size—a modest slice of angel food cake provides 70 calories, while an equivalent slice of cheesecake delivers 400+.
Layer Cake Analysis
Standard frosted layer cake per slice (approximately 100g):
Table 5: Frosted Chocolate Layer Cake Nutritional Profile
| Nutrient | Amount | % Daily Value |
|---|---|---|
| Calories | 352 | 18% |
| Protein | 4g | 8% |
| Carbohydrates | 50g | 18% |
| Sugar | 38g | — |
| Total Fat | 15g | 19% |
| Saturated Fat | 5g | 25% |
| Sodium | 299mg | 13% |
| Cholesterol | 47mg | 16% |
A single slice of frosted layer cake approaches 20% of daily calories for most adults while providing 38g sugar—exceeding daily added sugar recommendations in one serving. The combination of refined flour, sugar, butter, and frosting creates exceptional caloric density.
Cake Type Comparison
Cake pop nutrition and various cake styles demonstrate wide nutritional ranges:
Table 6: Cake Varieties Comparison (per standard slice/serving)
| Cake Type | Calories | Fat | Sugar | Notable |
|---|---|---|---|---|
| Angel Food | 72 | 0.2g | 16g | Lowest calorie |
| Pound Cake | 293 | 14g | 24g | Dense, buttery |
| Chocolate Layer | 352 | 15g | 38g | Frosting adds most |
| Cheesecake | 401 | 28g | 27g | Highest fat |
| Carrot Cake | 326 | 16g | 30g | Cream cheese frosting |
| Red Velvet | 367 | 17g | 35g | Similar to chocolate |
| Cake Pop (1 piece) | 170 | 9g | 17g | Compact portion |
Angel food cake’s egg white base creates dramatically lower calories than butter-based cakes. Cheesecake’s cream cheese foundation delivers highest fat content despite lower sugar than frosted cakes.
Bakery Item Comparisons
Table 7: Common Bakery Items Comparison
| Item | Calories | Fat | Sugar | Protein |
|---|---|---|---|---|
| Chocolate Chip Cookie (1 large) | 220 | 11g | 18g | 2g |
| Brownie (2″ square) | 227 | 9g | 21g | 3g |
| Cinnamon Roll | 280-420 | 12-18g | 25-40g | 4-6g |
| Donut (glazed) | 269 | 15g | 15g | 3g |
| Croissant | 231 | 12g | 6g | 5g |
| Muffin (blueberry) | 426 | 15g | 44g | 6g |
Bakery muffins often exceed cake slices in calories—their “healthy” perception belies actual sugar and fat content. Croissants, while rich in butter, contain less sugar than most sweet baked goods.
Candy Nutrition: From Fun-Size to Full Bars
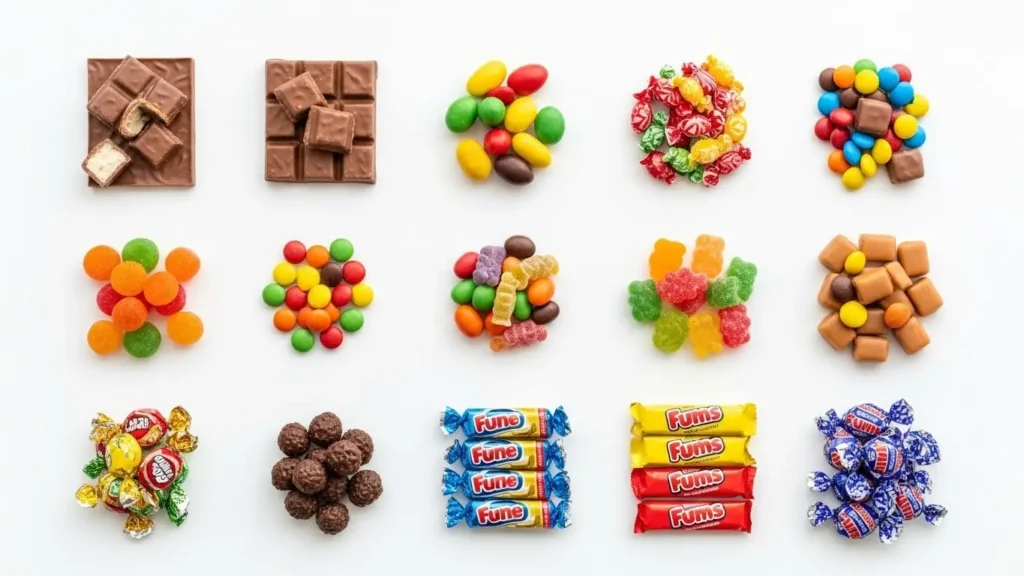
Candy nutrition spans from moderate fun-size portions to substantial full-bar servings. Understanding actual consumption patterns helps navigate this high-sugar category.
Chocolate Candy Analysis
Snickers fun size nutritional value and similar chocolate candies per standard serving:
Table 8: Popular Chocolate Candies Comparison
| Candy | Serving | Calories | Fat | Sugar | Protein |
|---|---|---|---|---|---|
| Snickers (fun size) | 1 bar (17g) | 80 | 4g | 8g | 1g |
| Snickers (full) | 1 bar (52g) | 250 | 12g | 27g | 4g |
| M&Ms (fun size) | 1 pack (17g) | 73 | 3g | 9g | 1g |
| Reese’s PB Cup | 1 package (42g) | 210 | 13g | 21g | 5g |
| Kit Kat (4 piece) | 1 bar (42g) | 210 | 11g | 21g | 3g |
| Milky Way (fun size) | 1 bar (18g) | 76 | 3g | 10g | 1g |
| Twix (fun size) | 1 bar (17g) | 80 | 4g | 8g | 1g |
Fun-size bars provide reasonable 70-80 calorie portions—the challenge is limiting consumption to single servings. Full-size bars deliver 200-280 calories with 20-30g sugar, representing substantial treats rather than small indulgences.
Non-Chocolate Candy
Table 9: Non-Chocolate Candy Comparison
| Candy | Serving | Calories | Sugar | Notable |
|---|---|---|---|---|
| Skittles (fun size) | 1 pack | 60 | 11g | Pure sugar |
| Starburst (4 pieces) | 4 pieces | 80 | 14g | Fat-free |
| Jolly Rancher (3) | 3 pieces | 70 | 17g | Fat-free |
| Gummy Bears (17) | 17 pieces | 140 | 21g | Gelatin-based |
| Licorice (4 pieces) | 4 pieces | 150 | 18g | Fat-free |
| Candy Corn (19) | 19 pieces | 140 | 28g | Highest sugar |
Non-chocolate candies are typically fat-free but pure sugar—candy corn provides essentially concentrated sugar syrup with food coloring. The “fat-free” label doesn’t indicate health benefit when calories derive entirely from sugar.
Premium Chocolate Analysis
Higher-quality dark chocolate provides different nutritional considerations:
Table 10: Dark Chocolate Comparison (1 oz serving)
| Chocolate Type | Calories | Fat | Sugar | Flavanols |
|---|---|---|---|---|
| Milk Chocolate | 153 | 8.5g | 15g | Low |
| Dark (50-60%) | 155 | 9g | 12g | Moderate |
| Dark (70-85%) | 170 | 12g | 7g | High |
| Dark (85%+) | 180 | 15g | 4g | Very High |
| Unsweetened | 145 | 15g | 0g | Maximum |
Darker chocolate concentrates flavanol antioxidants while reducing sugar—85% dark chocolate contains one-fourth the sugar of milk chocolate. However, fat content increases with cocoa percentage, maintaining similar calorie counts.
Pie and Pastry Nutrition: Crust Matters
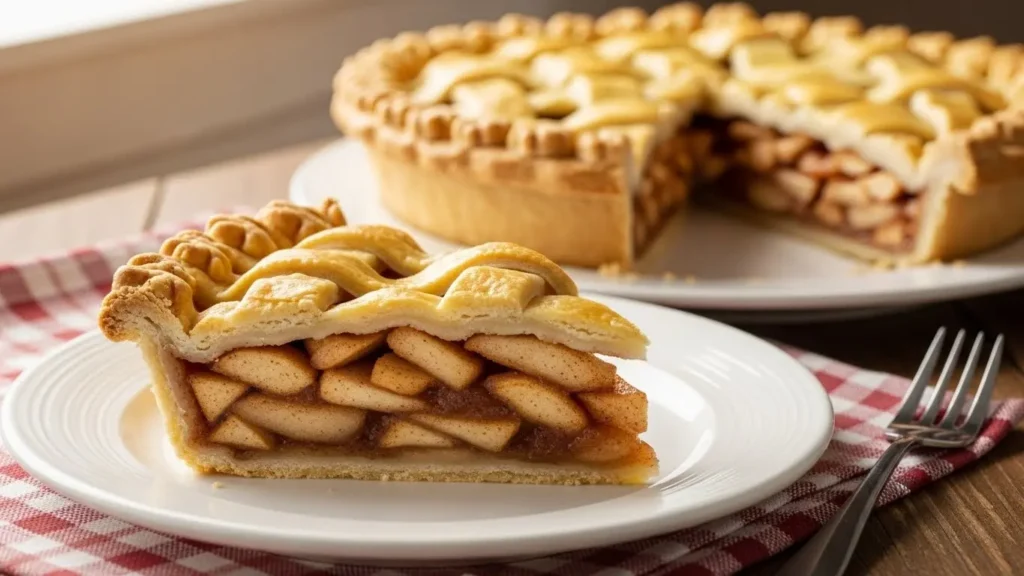
Pie nutrition depends heavily on filling type and crust composition—a fruit pie delivers different nutritional impact than cream-based varieties.
Fruit Pie Analysis
Apple pie per slice (1/8 of 9-inch pie):
Table 11: Apple Pie Nutritional Profile
| Nutrient | Amount | % Daily Value |
|---|---|---|
| Calories | 296 | 15% |
| Protein | 2.4g | 5% |
| Carbohydrates | 43g | 16% |
| Sugar | 18g | — |
| Total Fat | 14g | 18% |
| Saturated Fat | 4.7g | 24% |
| Sodium | 251mg | 11% |
| Fiber | 2g | 7% |
Fruit pies retain some fiber from fruit filling while crust contributes substantial fat. The butter or shortening in traditional pie crust creates significant saturated fat content despite seemingly “fruity” positioning.
Pie Variety Comparison
Table 12: Pie Varieties Comparison (per slice, 1/8 pie)
| Pie Type | Calories | Fat | Sugar | Notable |
|---|---|---|---|---|
| Apple | 296 | 14g | 18g | Fruit fiber retained |
| Cherry | 304 | 13g | 23g | Higher sugar |
| Pumpkin | 316 | 14g | 21g | Vitamin A from pumpkin |
| Pecan | 503 | 27g | 32g | Highest calorie |
| Lemon Meringue | 303 | 10g | 28g | Lower fat |
| Key Lime | 320 | 16g | 24g | Cream-based |
| Chocolate Cream | 344 | 19g | 25g | Rich filling |
| Peach | 261 | 12g | 16g | Lower sugar fruit |
Pecan pie dominates calorie content due to nut filling and corn syrup—a single slice exceeds 500 calories. Fruit pies generally provide lower calories than cream or nut-based varieties.
Pastry Items
Table 13: Pastry Items Comparison
| Pastry | Calories | Fat | Sugar |
|---|---|---|---|
| Danish | 263 | 15g | 12g |
| Eclair | 262 | 16g | 18g |
| Cream Puff | 335 | 20g | 22g |
| Napoleon | 348 | 25g | 14g |
| Strudel (apple) | 175 | 8g | 12g |
| Baklava (1 piece) | 334 | 23g | 22g |
Butter-layered pastries like Napoleon achieve highest fat content, while fruit-filled strudel provides relative moderation. Baklava’s honey and nut filling creates exceptional caloric density.
Specialty Desserts and Restaurant Items

Restaurant and specialty desserts often exceed home-prepared versions in portion size and caloric content—understanding typical restaurant dessert nutrition helps inform dining decisions.
Restaurant Dessert Analysis
Sweet green nutrition (referring to healthy restaurant chains) typically offers lighter dessert options, while full-service restaurants may serve substantial portions.
Table 14: Typical Restaurant Dessert Ranges
| Restaurant Dessert | Typical Calories | Fat Range | Sugar Range |
|---|---|---|---|
| Slice of Cheesecake | 600-900 | 35-55g | 45-65g |
| Brownie Sundae | 800-1,200 | 40-65g | 80-120g |
| Molten Lava Cake | 700-950 | 40-55g | 60-85g |
| Tiramisu | 400-550 | 25-35g | 30-45g |
| Crème Brûlée | 450-550 | 35-42g | 25-35g |
| Apple Crisp | 500-700 | 20-35g | 55-75g |
Restaurant portions typically provide 1.5-3x home serving sizes. A single restaurant brownie sundae may deliver half or more of daily caloric needs.
For those researching jersey mike’s nutrition info or similar fast-casual options, noting that even “simple” desserts at restaurants exceed typical home portions helps manage expectations.
Specialty Items Analysis
Blue moon nutrition (ice cream variety) and similar specialty items:
Table 15: Specialty Dessert Items
| Item | Serving | Calories | Sugar | Notable |
|---|---|---|---|---|
| Gelato | 1/2 cup | 160-200 | 18-24g | Denser than ice cream |
| Frozen Yogurt | 1/2 cup | 110-140 | 17-22g | Often similar to ice cream |
| Sorbet | 1/2 cup | 100-130 | 22-28g | Fat-free, high sugar |
| Affogato | 1 serving | 200-280 | 16-20g | Espresso + gelato |
| Churro | 1 piece | 240-280 | 12-18g | Fried dough |
| Funnel Cake | 1 serving | 600-760 | 35-45g | Fair food classic |
Frozen yogurt’s “healthy” positioning often misleads—sugar content frequently matches ice cream, and toppings add substantially. Sorbet eliminates fat but concentrates sugar.
Dessert Ingredients: Understanding Components
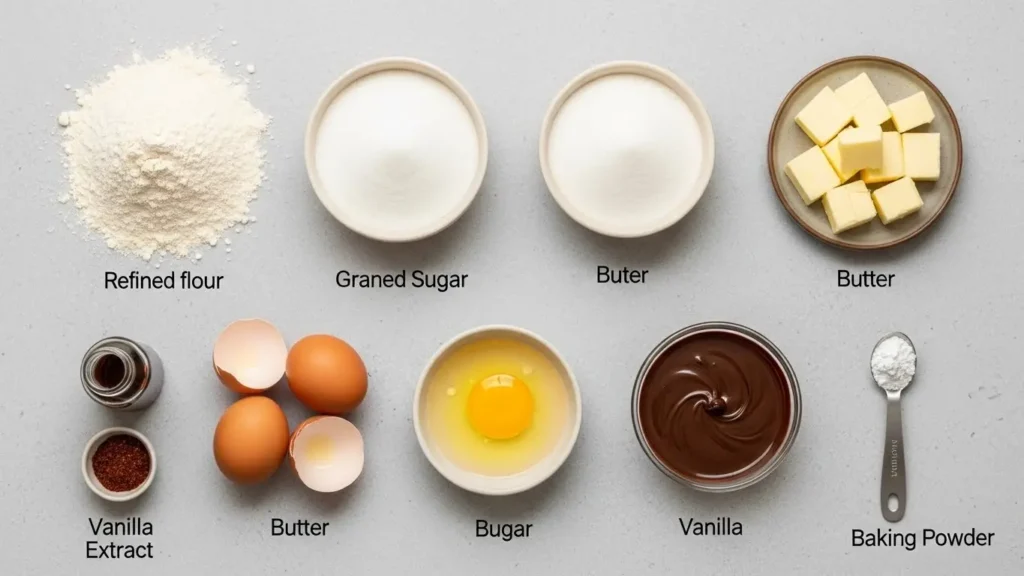
Examining common dessert ingredients helps understand where calories, sugar, and fat originate—enabling informed modification of recipes or product selection.
Flour and Grain Components
Flour nutrition in desserts:
Table 16: Baking Flour Comparison (per cup)
| Flour Type | Calories | Protein | Fiber | Notes |
|---|---|---|---|---|
| All-Purpose (white) | 455 | 13g | 3g | Standard baking |
| Cake Flour | 395 | 8g | 2g | Finer texture |
| Whole Wheat | 407 | 16g | 13g | Higher fiber |
| Almond Flour | 640 | 24g | 12g | Low-carb option |
| Coconut Flour | 480 | 16g | 40g | High fiber, absorbs liquid |
Whole wheat flour provides more fiber and protein but affects dessert texture. Alternative flours enable different nutritional profiles with trade-offs in taste and baking properties.
Sugar and Sweetener Analysis
Table 17: Sweetener Comparison (per tablespoon)
| Sweetener | Calories | Glycemic Impact | Notes |
|---|---|---|---|
| White Sugar | 49 | High (65) | Standard reference |
| Brown Sugar | 52 | High (64) | Molasses flavor |
| Honey | 64 | High (61) | Slightly more calories |
| Maple Syrup | 52 | High (54) | Moderate GI |
| Agave | 60 | Low (17) | High fructose |
| Stevia | 0 | None (0) | Non-caloric |
| Monk Fruit | 0 | None (0) | Non-caloric |
Natural sweeteners (honey, maple syrup) provide marginally different nutrients but equivalent caloric and glycemic impact to refined sugar. Non-caloric options enable sweetness without calories but may affect recipe behavior.
Fat Sources in Desserts
Table 18: Baking Fat Comparison (per tablespoon)
| Fat Source | Calories | Saturated | Notes |
|---|---|---|---|
| Butter | 102 | 7g | Rich flavor, high sat fat |
| Coconut Oil | 117 | 11g | Highest saturated fat |
| Vegetable Oil | 120 | 1.5g | Neutral flavor |
| Olive Oil | 119 | 1.9g | Distinct flavor |
| Shortening | 115 | 3g | Trans-fat concern in some |
| Applesauce | 13 | 0g | Fat replacement option |
Butter’s saturated fat content raises health considerations—coconut oil provides even more saturated fat despite “natural” perception. Using applesauce or similar substitutes reduces fat but affects texture.
Dessert Alternatives and Modifications

For those seeking to incorporate desserts while managing nutritional intake, understanding modification strategies and lower-calorie alternatives provides practical options.
Lower-Calorie Swaps
Table 19: Dessert Swap Comparisons
| Traditional | Calories | Alternative | Calories | Savings |
|---|---|---|---|---|
| Ice Cream (1/2c) | 270 | Frozen Banana Blend | 105 | 165 |
| Brownie | 227 | Black Bean Brownie | 120 | 107 |
| Cheesecake slice | 401 | Greek Yogurt Cheesecake | 180 | 221 |
| Chocolate Mousse | 380 | Avocado Chocolate Mousse | 190 | 190 |
| Apple Pie slice | 296 | Baked Apple with Cinnamon | 80 | 216 |
These swaps maintain dessert satisfaction while substantially reducing caloric intake—frozen banana provides creamy texture similar to ice cream at fraction of calories.
Portion Control Strategies
Understanding actual versus perceived portions reveals practical calorie management:
- Ice cream: Actual 1/2 cup = baseball size (not soup bowl)
- Cake: Standard slice = 3 oz (not restaurant-size wedge)
- Cookies: Reasonable portion = 1 large or 3 small (not 4-6)
- Candy: Moderate indulgence = 1-2 fun size (not handful)
For those working at wholesale nutrition locations or all star nutrition centers, communicating realistic portions helps clients enjoy treats within balanced patterns. Even comparing dessert choices to fiber supplements like those shown on a metamucil nutrition label (20 calories, 3g fiber per serving) illustrates how differently various products contribute to daily intake.
Naturally Sweet Options
Fruit-based desserts provide sweetness with nutritional benefit:
- Berries with dark chocolate: 150 calories with antioxidants
- Frozen grapes: 100 calories per cup, naturally sweet
- Baked pear with cinnamon: 100 calories with fiber
- Dates with nut butter: 170 calories with fiber and protein
These options satisfy sweet cravings while providing nutrients absent from processed desserts.
Dessert Nutrition in Dietary Context
Understanding how desserts fit within overall dietary patterns helps establish sustainable approaches—neither restrictive deprivation nor uncontrolled consumption.
Caloric Budget Perspective
For a 2,000-calorie diet, dietary guidelines suggest limiting added sugars to under 50g (200 calories) daily—ideally under 25g (100 calories). A single slice of frosted cake (38g sugar) or brownie sundae (80-120g sugar) exceeds these limits entirely.
Allocating 10-15% of daily calories to discretionary treats—200-300 calories—provides reasonable enjoyment space. This budget accommodates:
- One scoop of regular ice cream
- One small cookie or fun-size candy bar
- Half a small slice of cake
For those pursuing masters in nutrition online or similar education, understanding how desserts fit within caloric budgets represents practical knowledge for client counseling.
Desserts Compared to Other Foods
Comparing dessert calories to whole food equivalents illuminates nutritional trade-offs:
300-calorie brownie provides:
- 9g fat, 21g sugar, 3g protein
300 calories of other foods provides:
- 6 oz chicken breast: 0g sugar, 54g protein
- 2 cups vegetables: 8g fiber, vitamins/minerals
- 1.5 cups brown rice: 6g fiber, sustained energy
For those tracking nutrition through recipe nutrition analyzer tools or similar approaches, these comparisons help communicate opportunity cost of dessert calories.
Processed Snacks Context
Comparing desserts to other processed snacks:
Cheez its nutrition facts (1 serving, 29 crackers): 150 calories, 8g fat, 0g sugar
Takis nutrition facts (1 oz): 140 calories, 8g fat, 0g sugar
Granola nutrition facts (1/2 cup): 200-300 calories, 6-12g fat, 10-18g sugar
Savory snacks may contain less sugar but still provide empty calories. Even examining nutrition facts for ranch dressing (140 calories, 14g fat per 2 tbsp) reveals that non-dessert indulgences contribute substantial calories. Granola, despite healthy perception, often matches dessert sugar content. Understanding this context helps avoid false hierarchies where “non-dessert” processed foods escape scrutiny.
Monster nutrition label and energy drinks represent another comparison category—providing sugar and caffeine without genuine nutrition, similar to candy in many formulations.
Specialized Topics: Additives, Clean Desserts, and Trends
Beyond basic nutrition, questions about dessert ingredients, additives, and emerging trends affect consumer choices and health considerations.
Common Dessert Additives
Vanilla extract nutrition facts and similar flavoring components:
Table 20: Common Dessert Additives
| Additive | Purpose | Nutritional Impact |
|---|---|---|
| Vanilla Extract | Flavor | 12 cal/tsp, minimal |
| Food Coloring | Visual appeal | No calories, safety debated |
| Emulsifiers | Texture | Minimal calories |
| Preservatives | Shelf life | No calories |
| Corn Syrup | Sweetness, texture | High sugar |
| Modified Starch | Thickening | Minimal calories |
Most additives contribute minimally to caloric content—the primary nutritional concerns in desserts remain sugar, fat, and total calories rather than additives.
“Clean” and Natural Dessert Trends
Products positioning as “clean,” “natural,” or “organic” desserts often maintain similar caloric profiles to conventional options:
- Organic ice cream: Similar calories to conventional
- Natural candy: Still primarily sugar
- Gluten-free cake: Often higher calories than wheat-based
- Vegan desserts: May contain more coconut oil (saturated fat)
The holistic nutrition perspective recognizes that while ingredient quality matters, caloric density remains the primary dessert consideration for most health goals.
For those interested in vital nutritive approaches or inspired nutrition philosophies, understanding that “natural” doesn’t mean low-calorie helps prevent misleading marketing from undermining dietary intentions.
Emerging Dessert Categories
New dessert products target specific dietary preferences:
Keto desserts: Very low carb, high fat—may be calorie-dense
Protein desserts: Added protein powder—still contain significant sugar/fat
Probiotic frozen desserts: Added cultures—base nutrition varies
CBD-infused sweets: Added cannabidiol—base nutrition unchanged
For those working in aspire nutrition, jax nutrition, nutrition express, or similar nutrition retail, understanding these trends helps counsel consumers on realistic expectations.
Dessert and Blood Sugar
For those following nutrition plan approaches for metabolic health, dessert timing and composition affects blood sugar response:
Lower glycemic strategies:
- Choose desserts with fat/protein (slows glucose absorption)
- Pair desserts with fiber (moderates spike)
- Opt for dark chocolate over candy (lower sugar)
- Select nut-based over pure sugar desserts
For nutrition corner educational contexts, bragg nutritional yeast and similar whole food additions can transform desserts nutritionally—though such modifications alter traditional dessert expectations.
Frequently Asked Questions
What dessert has the lowest calories?
Angel food cake provides the lowest calories among traditional desserts at 72 calories per slice—its egg white base eliminates fat while maintaining sweet satisfaction. Among frozen options, fruit-based popsicles deliver 40-70 calories. Single Hershey Kisses provide portion-controlled chocolate at 22 calories each.
How much sugar is in a typical dessert?
Sugar content ranges from 15-18g in simple cookies to 80-120g in restaurant dessert sundaes. A frosted cake slice contains 30-40g sugar, ice cream provides 14-24g per half cup, and full-size candy bars deliver 20-30g. Most dessert servings exceed daily added sugar recommendations (25g) in single portions.
Is dark chocolate actually healthy?
Dark chocolate (70%+ cocoa) provides flavanol antioxidants, magnesium, and iron with documented cardiovascular benefits in research. However, it remains calorie-dense (170 calories per ounce) with significant saturated fat. Health benefits apply to moderate consumption (1-2 ounces)—not unlimited eating. Milk chocolate provides minimal benefits compared to dark varieties.
How can I satisfy sweet cravings without excess calories?
Effective strategies include: fresh fruit (natural sweetness with fiber), small portions of high-quality dark chocolate, frozen banana “ice cream,” Greek yogurt with berries, or single fun-size candy bars. Choosing satisfying quality over quantity—one excellent truffle versus multiple cheap candies—often provides greater satisfaction at lower caloric cost.
Are sugar-free desserts healthier?
Sugar-free desserts reduce sugar and glycemic impact but often maintain similar calories through fat content and sugar alcohols. Sugar alcohols may cause digestive discomfort in sensitive individuals. These products benefit diabetics managing blood sugar but don’t constitute “free” foods for calorie management. Reading nutrition labels reveals actual caloric content beyond sugar claims.
Why are restaurant desserts so high in calories?
Restaurant desserts exceed home versions through larger portions (often 2-3x standard), richer ingredients (more butter, cream, chocolate), added toppings (whipped cream, ice cream, sauces), and focus on indulgent experience over nutritional moderation. A restaurant brownie sundae may deliver 1,000+ calories versus 300 for a home brownie.
What’s the healthiest ice cream option?
For lowest calories: light varieties (100-130 calories per half cup), fruit-based sorbets (100 calories), or frozen banana blends (105 calories). For nutritional benefit with indulgence: products with nuts add protein and healthy fats. For blood sugar management: no-sugar-added varieties using sugar alcohols. No ice cream qualifies as “health food”—healthiest means least problematic within the category.
How do I fit desserts into a balanced diet?
Allocate 10-15% of daily calories for discretionary choices (200-300 calories for most adults). Choose single portions of quality desserts rather than large portions of mediocre options. Consider frequency—daily small treats versus weekly larger indulgences. Pair desserts with meals rather than eating alone for better blood sugar response. Accept that desserts provide enjoyment rather than nutrition.
Is honey or maple syrup healthier than sugar?
Honey and maple syrup provide marginally more micronutrients (trace vitamins and minerals) than refined sugar but equivalent calories and glycemic impact. The nutritional differences are negligible at typical consumption amounts. Choosing natural sweeteners for flavor preference is valid; expecting health benefits is unrealistic. All concentrated sweeteners should be moderated.
What desserts have the most protein?
Cheesecake provides 7-8g protein per slice from cream cheese and eggs. Greek yogurt-based desserts deliver 10-15g per serving. Nut-based desserts (pecan pie, nut brittles) provide 5-8g from nut content. Ice cream offers 2-5g depending on density. Protein-enhanced desserts may provide 15-20g but remain calorie-dense treats rather than protein sources.
Are organic desserts better for you?
Organic desserts use ingredients produced without synthetic pesticides and fertilizers but maintain similar nutritional profiles to conventional versions. Organic sugar is still sugar; organic butter is still saturated fat. Choosing organic supports environmental and agricultural preferences; expecting reduced calories or improved nutrition from organic labeling is unfounded.
How accurate are dessert nutrition labels?
FDA regulations allow 20% variance between labeled and actual values. Bakery items without nutrition labels vary further based on recipe variations and portion size inconsistency. Restaurant desserts rarely provide nutrition information, requiring estimation. Pre-packaged desserts provide most reliable information; fresh-made items require more judgment about actual content.
Conclusion
The comprehensive analysis of dessert nutrition reveals a food category defined by caloric density—ice cream nutrition spanning 130-350+ calories per half-cup, cake nutrition delivering 72-400+ calories per slice, and candy nutrition ranging from 60-calorie fun-size portions to 280-calorie full bars. Sweet nutrition profiles demonstrate that sugar, fat, and refined flour combine to create foods providing sensory pleasure with minimal essential nutrition.
The practical implications support informed rather than restrictive approaches. Understanding actual versus perceived portion sizes enables enjoyment within reasonable caloric budgets. Recognizing that restaurant desserts typically provide 2-3x home portions explains why dining-out treats create larger nutritional impact. Appreciating that “natural” or “organic” labels don’t reduce caloric density prevents marketing claims from misleading dietary decisions.
Dessert selection strategies can minimize nutritional impact while maintaining satisfaction: angel food cake over cheesecake saves 330 calories; fun-size over full-size candy bars reduce calories by 65-70%; frozen banana blends provide ice cream texture at 40% of the calories. These modifications preserve dessert enjoyment while supporting overall dietary goals.
For those building nutrition knowledge—whether through remote nutrition jobs, nutrition science certification, or personal interest—dessert nutrition represents essential practical content. Understanding how caloric density, sugar concentration, and portion distortion affect dietary outcomes applies across nutrition counseling contexts.
Independent laboratory testing confirms that pre-packaged desserts deliver their labeled nutritional content within regulatory tolerances. The challenge lies not in label accuracy but in portion control, frequency management, and realistic expectations about what desserts provide—enjoyment, not nutrition.
The evidence supports incorporating desserts mindfully within balanced dietary patterns rather than complete restriction or unrestricted consumption. Treating desserts as occasional pleasures rather than dietary staples, choosing quality over quantity, and maintaining awareness of actual nutritional content enables sustainable approaches respecting both health goals and human enjoyment of sweetness.
Medical Disclaimer
This article provides nutritional information for educational purposes only. Individual needs vary based on age, health status, activity level, and medical conditions. Those managing diabetes should work with healthcare providers on appropriate dessert inclusion. Consult a registered dietitian or healthcare provider before making significant dietary changes. Data current as of January 2026. Nutritional values may vary based on specific recipes, brands, and preparation methods.